Projects
UCSB Research and Course Work
All Work Done Through R Studio and ArcMap Pro
Project 1
COVID-19 Data Analysis
Found “safe” counties in California
Found highest cumulative, daily new, and 7 day rolling average of cases by county
Look at state level data in total cases and per capita

Project 2
U.S Border Statistics
Looks at areas and populations within 100 miles from any US Border
Majority of Americans live within 100 miles of the national border <<<<<<< HEAD
Identify every city in which US Border Patrol has jurisdiction

Project 3
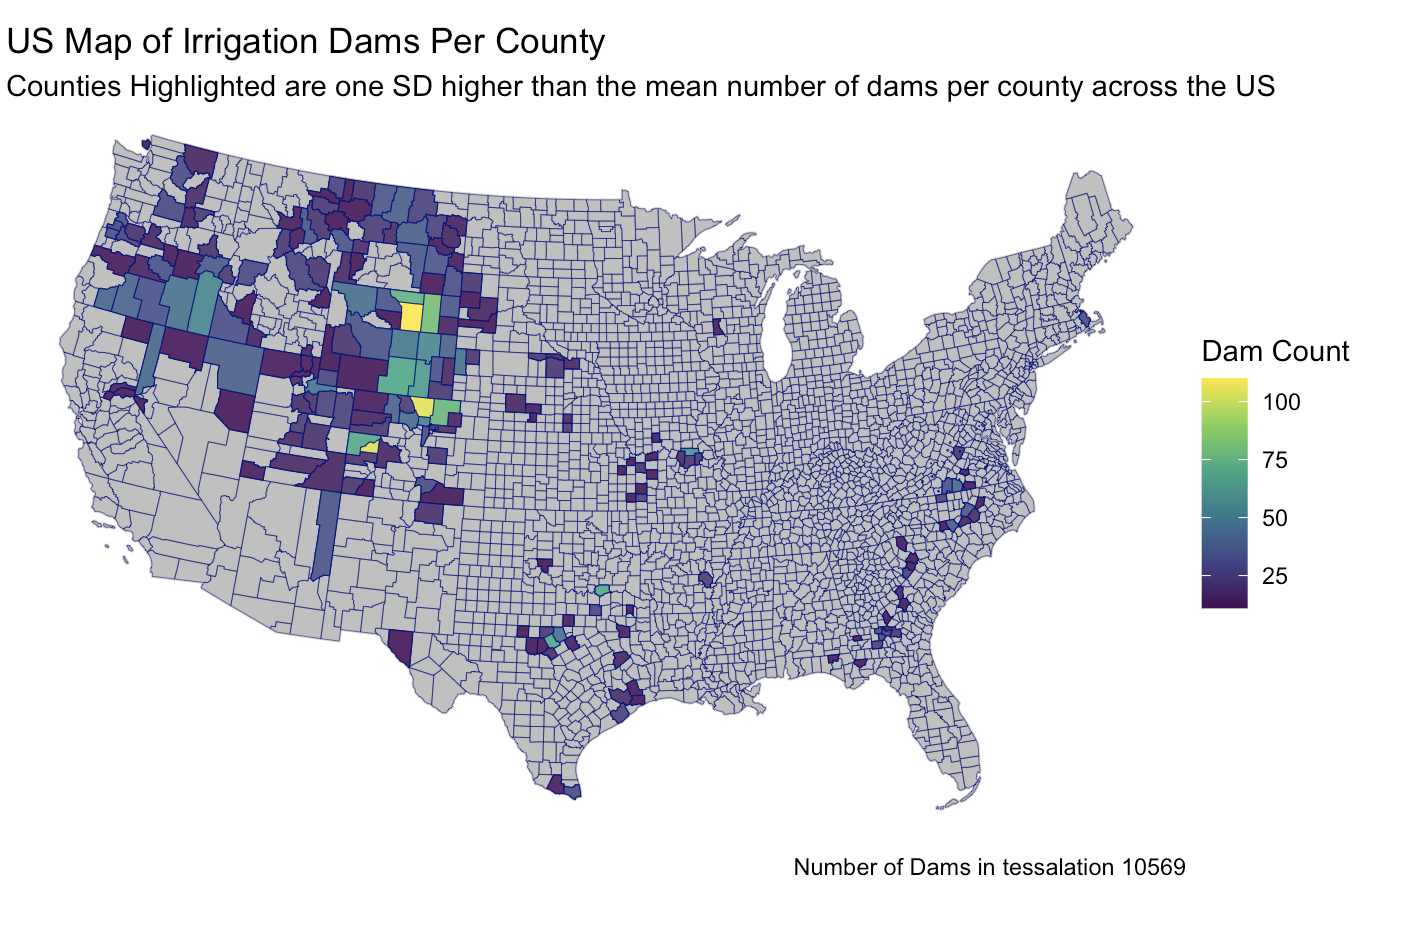
US National Dam Tessalations
Look at different tessalations of US County lines to identify modifiable arial unit problems
Analysis on dams to find where the highest dam counts are based on uses of dams
Point in polygon function to idenditfy number of dams in counties
Project 4
Raster Flood Analysis
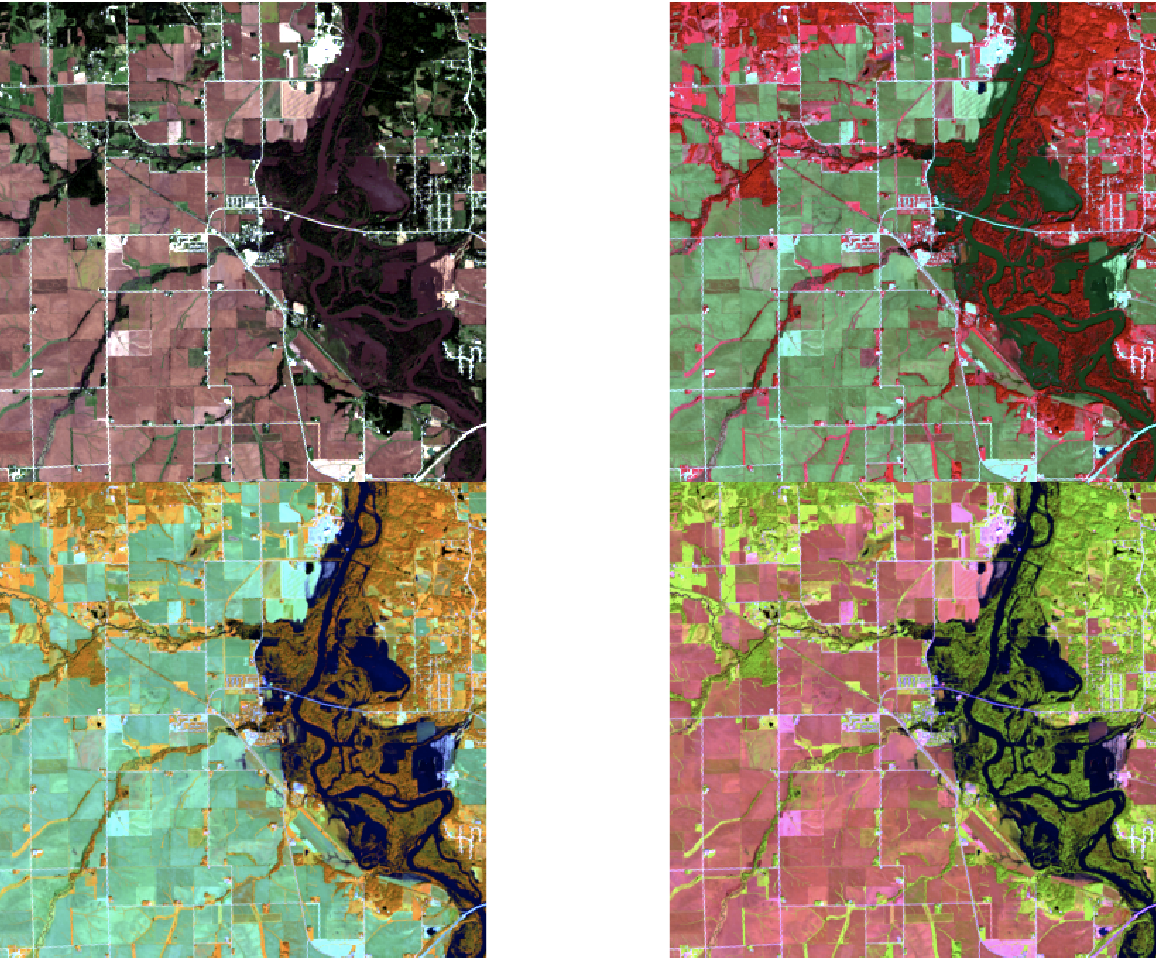
Read in web based landsat imagery of Palo, Iowa during a flood with the goal of locating flooded regions
Using remote sensing data, function created to manipulated bands in satelite images to produce water oriented raster images
Tested 5 different flooding index function and compared accuracy
 ****
****
Project 5
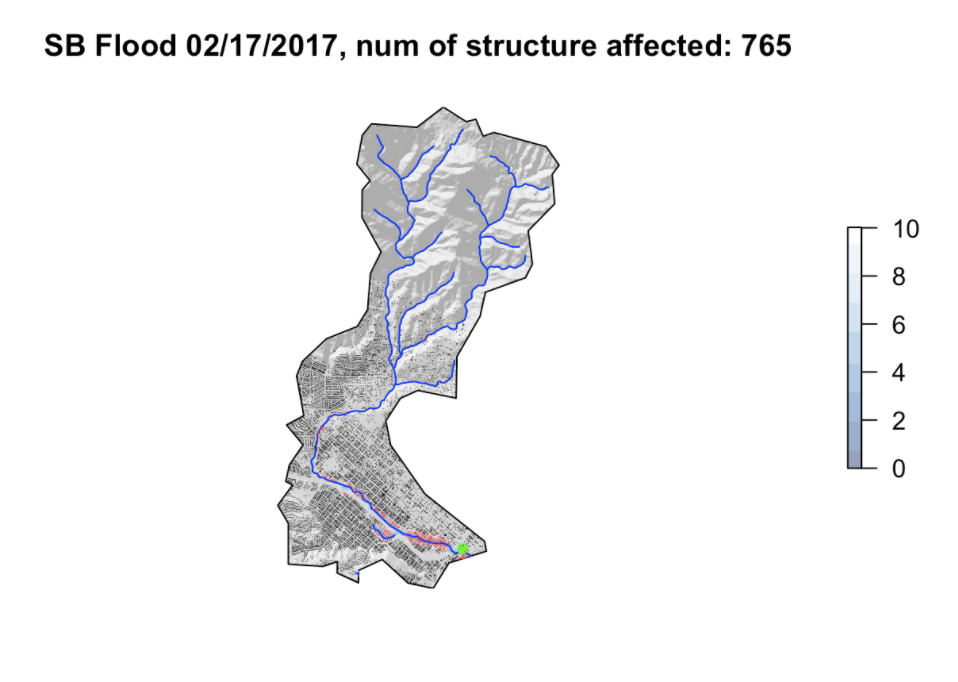
Flood Risk in Mission Creek
Analyzed the Santa Barbara basin to understand how floods will effect infastructure
Using raster and vector data all points within basin can be indentified relative to nearest stream elevation
GIF created that shows flooding effects at 20 different flood levels
Project 6
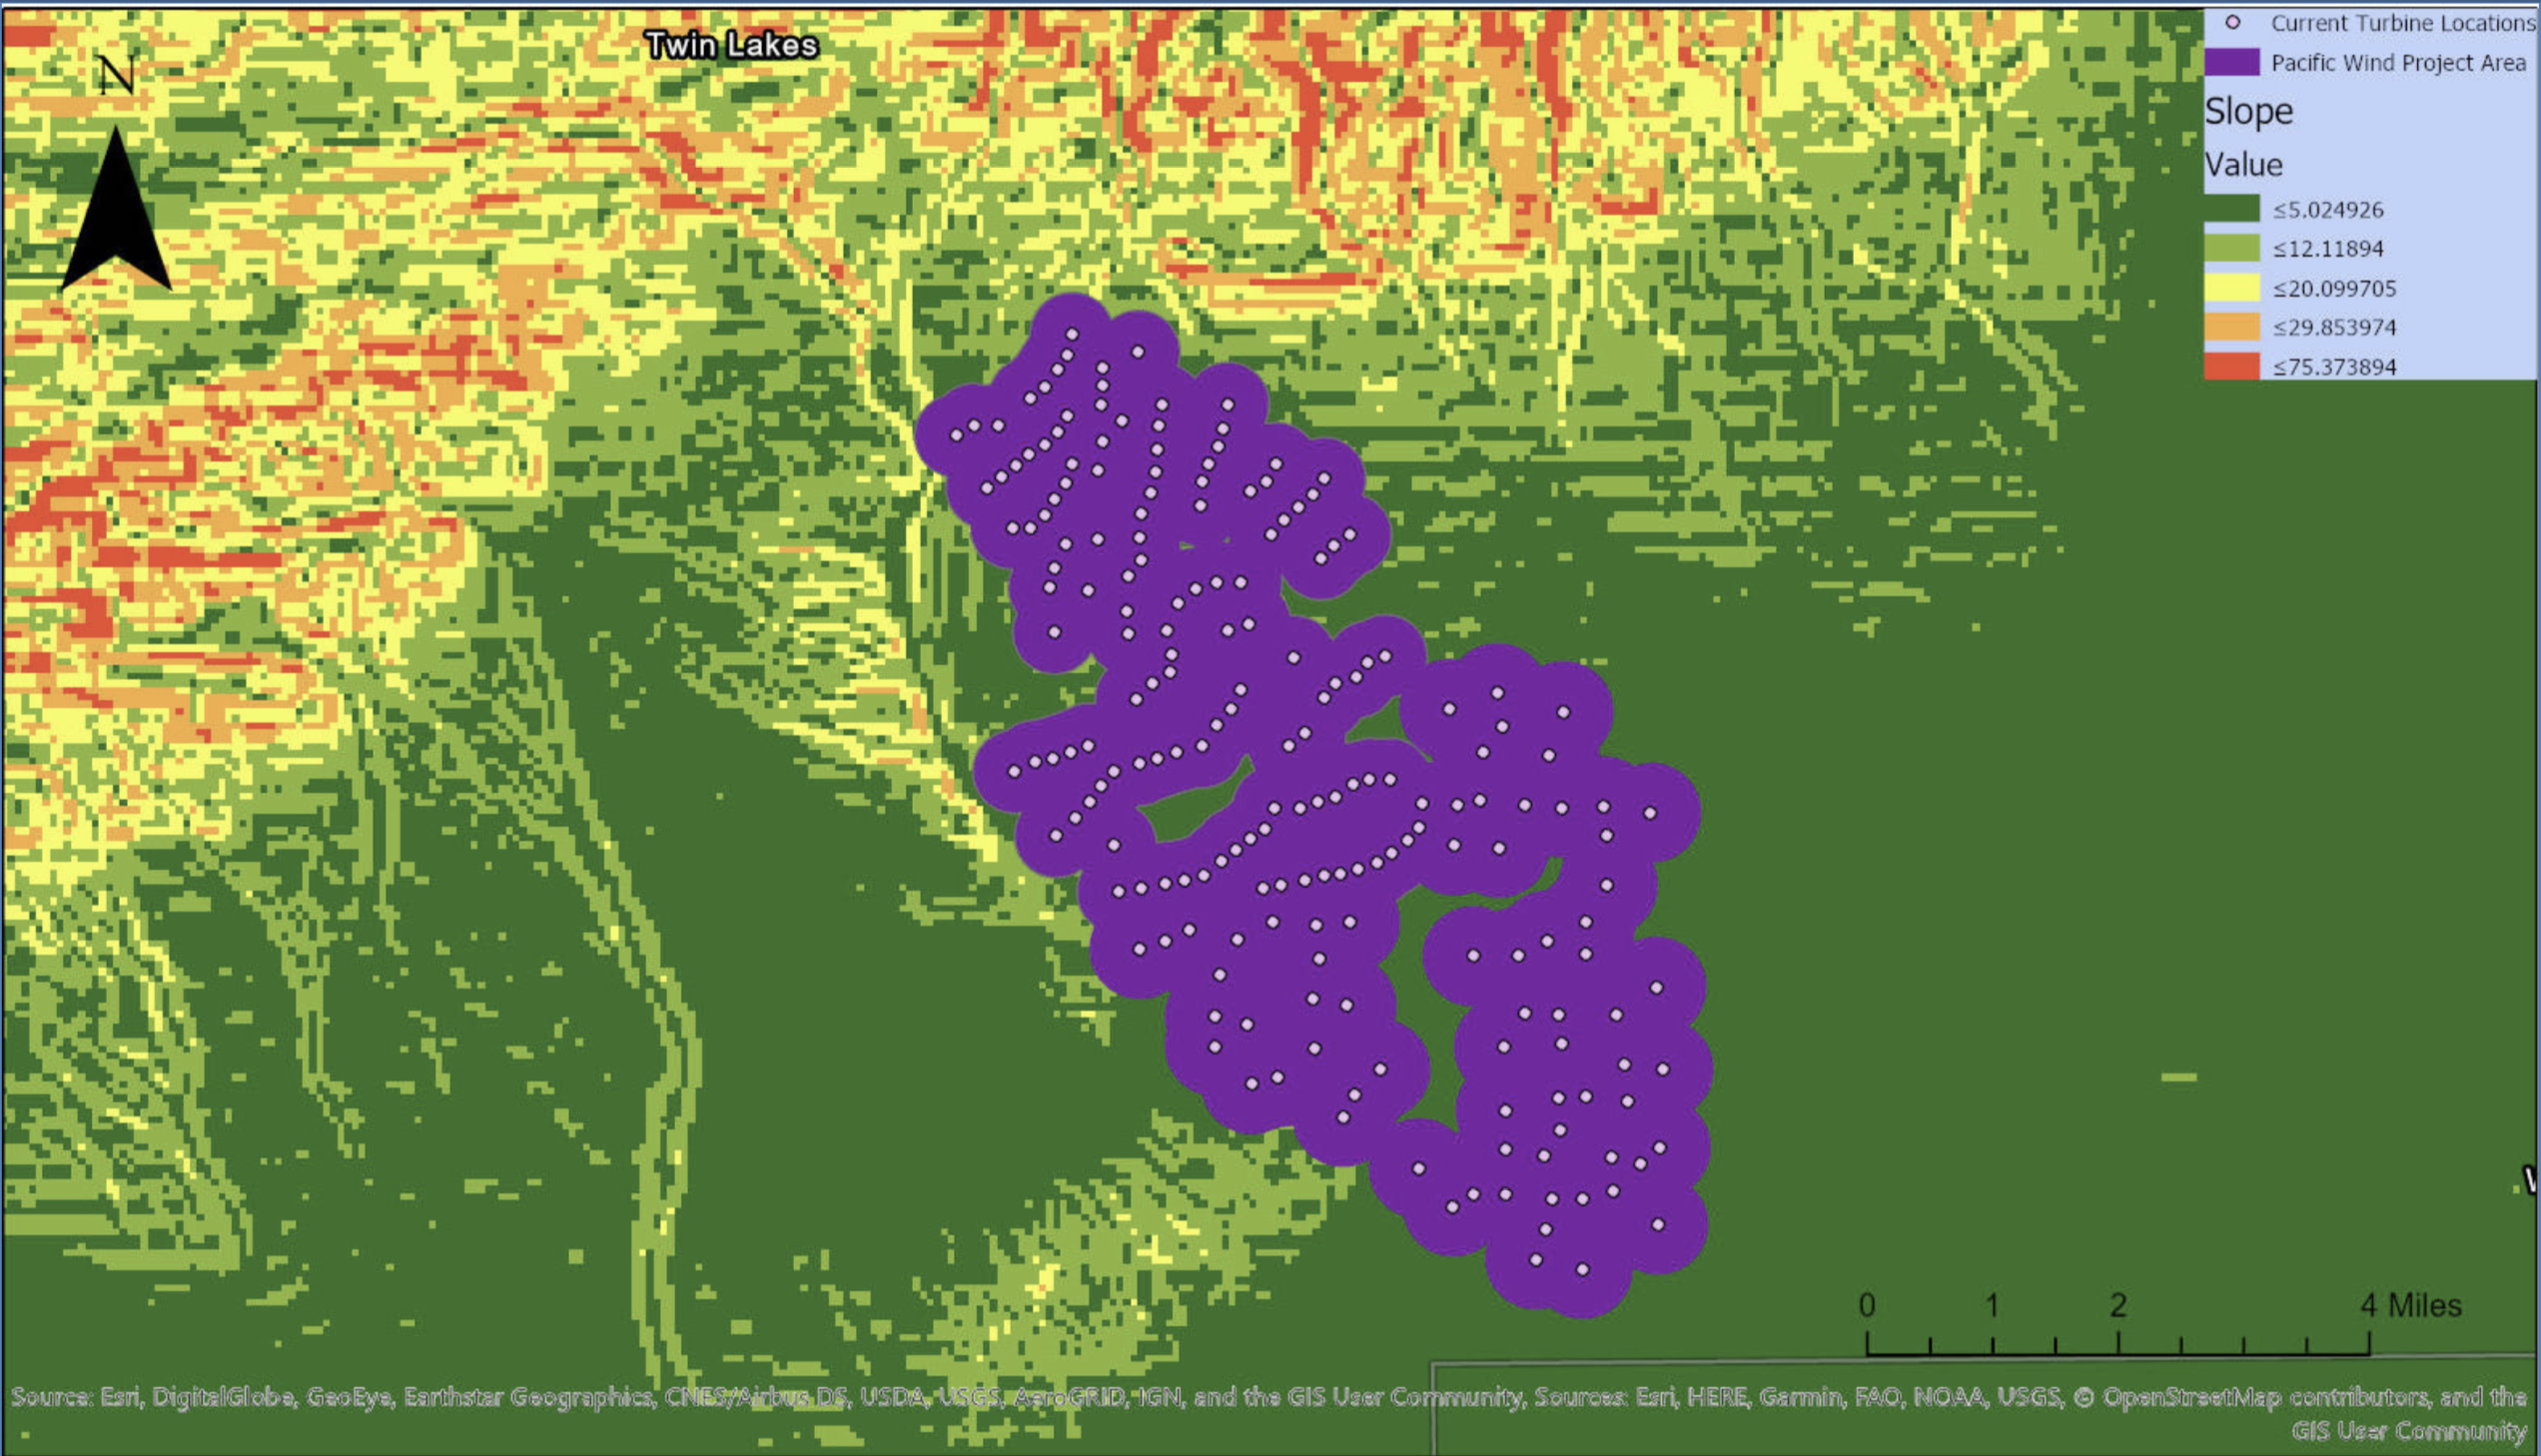
Wind Turbine Power Density Analysis
Determined the effect of land factors on power density (w/m2) of wind turbines with regression analysis
From analysis, located ideal place to construct future wind turbine facility to meet needs of Kern County
Project 7
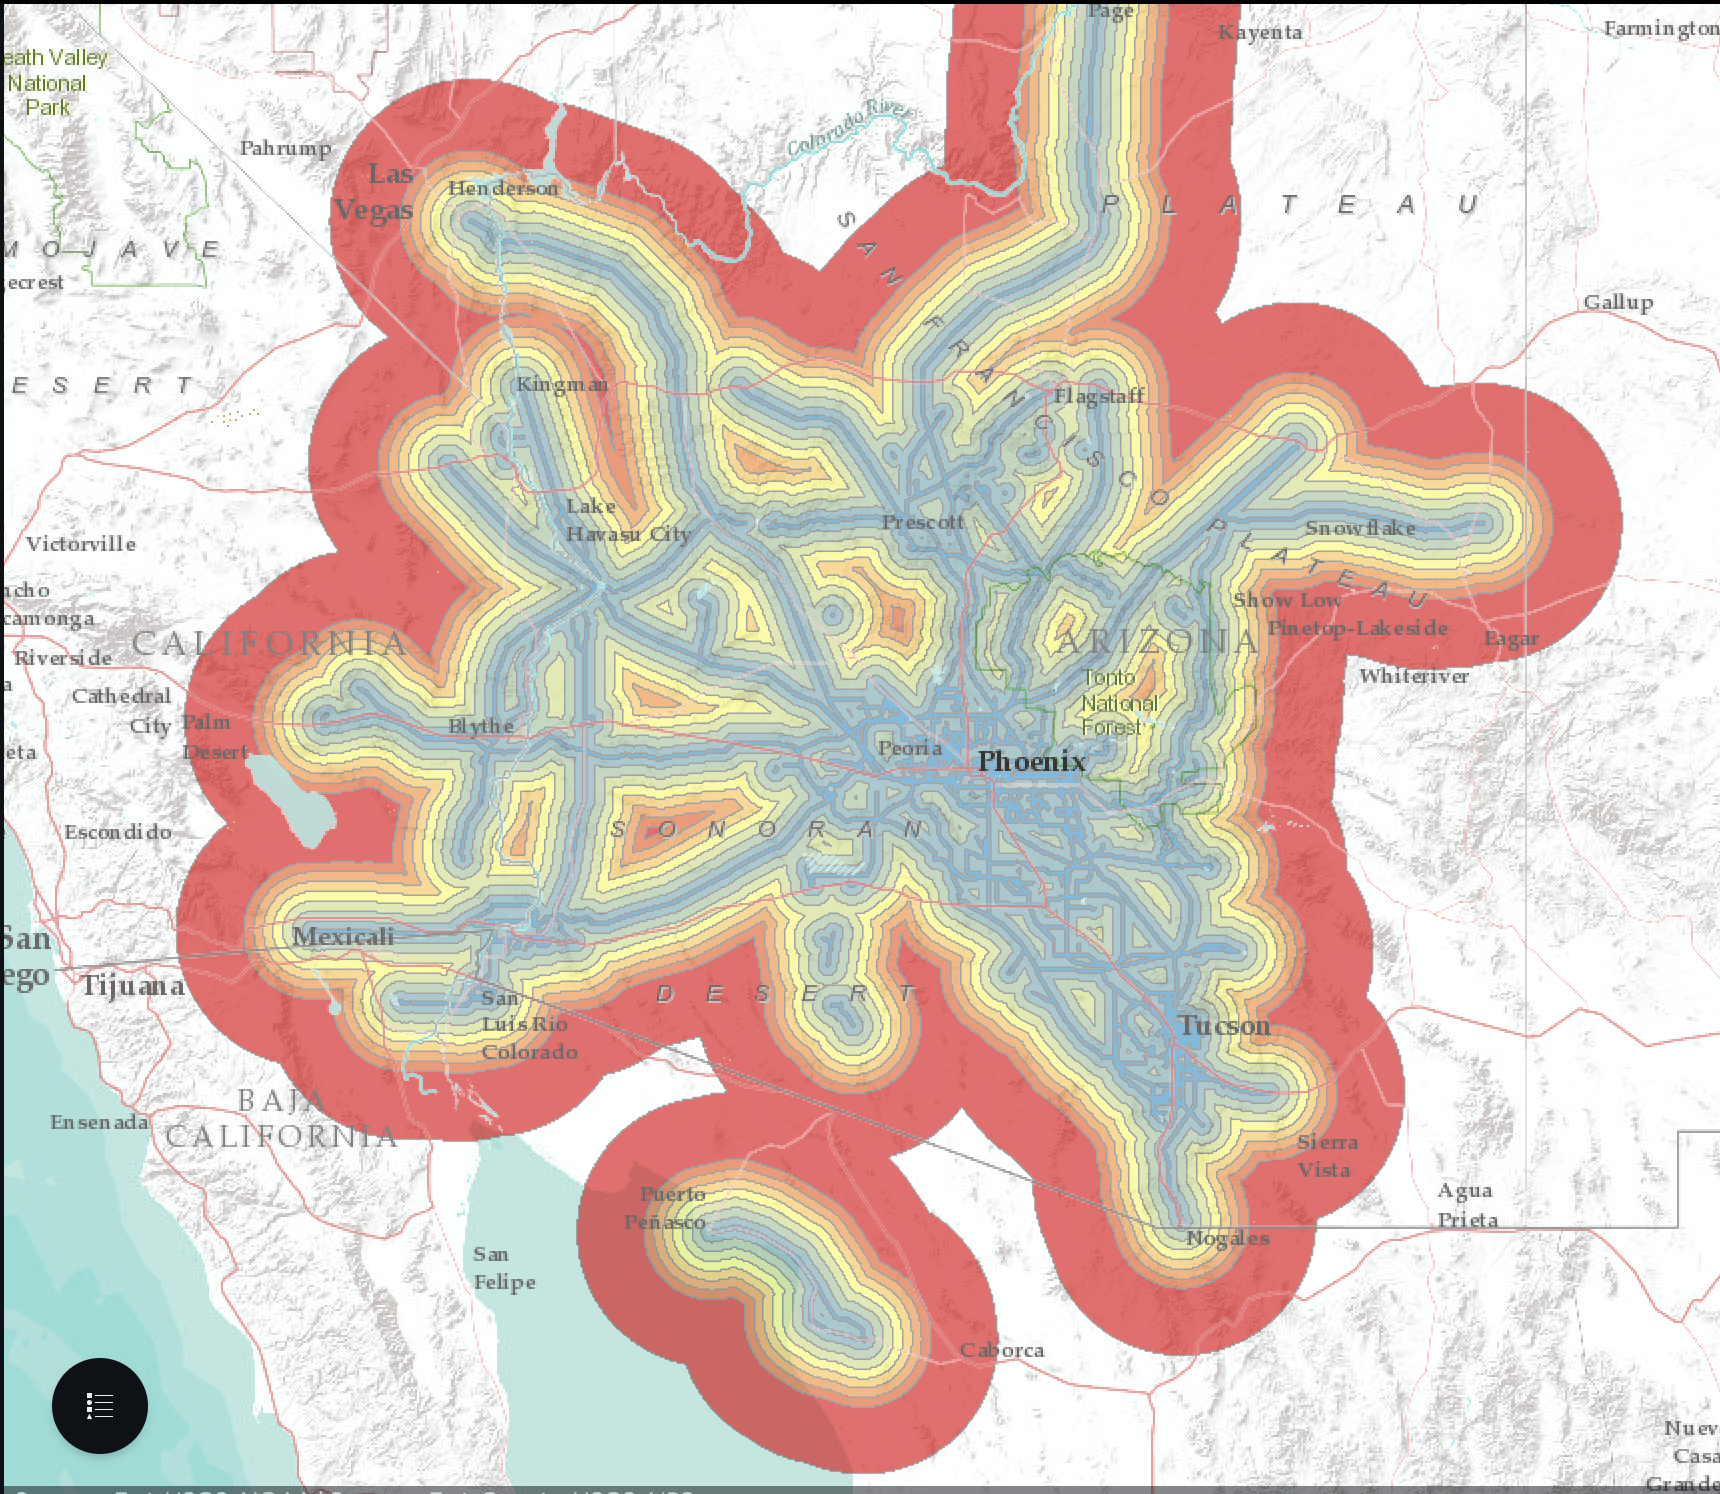
Arizona Solar Panels
Based on data layers from electrical grids, wildlife, DEM, solar radiation, and cities a solar suitabilty map was generated.
Ideal location for photovoltaic panels was determined based upon the generated suitability data layer.
Project 8
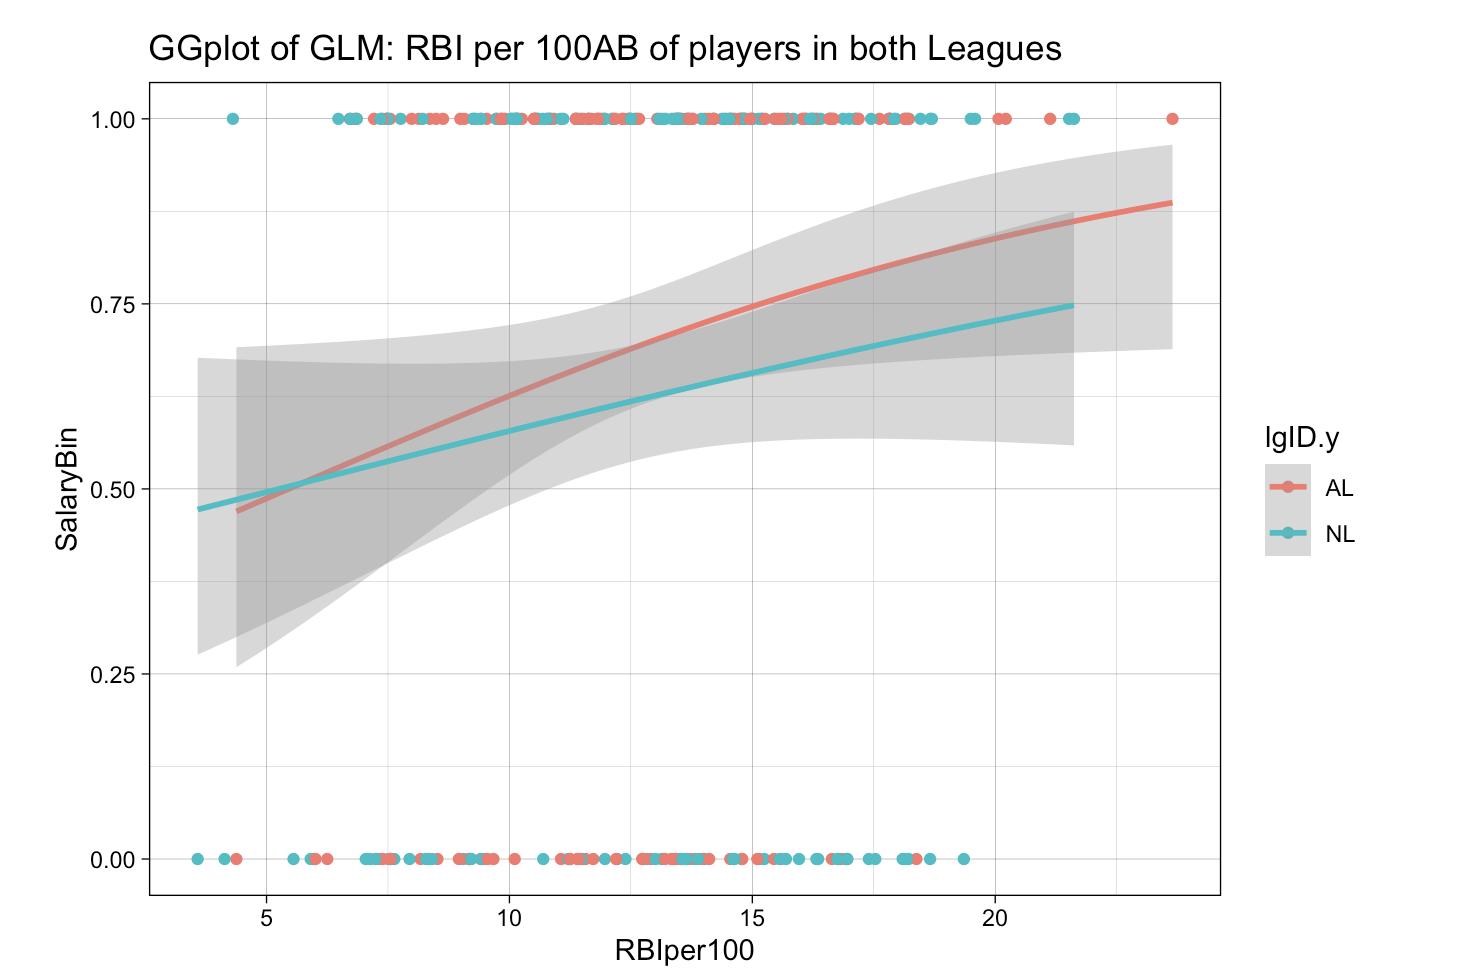
Do Baseball Players Earn Their Salary?
Used 2016 offensive hitting statistics and salary data to compare high and low paid players
Analysis used T-test, Wilcox Rank Sum, Linear Models, ANOVA, Tukey-Kramer, Generalized Linear Models
conclusion: As MLB hall of famer Jeff Kent once said, “the money lies in the RBI’s”
